
This page will explain how to interpret a 3-D chart like the following:
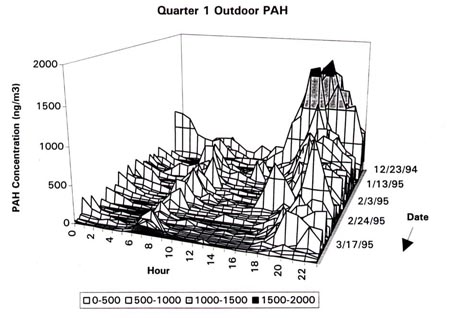
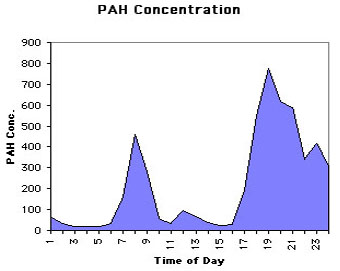
This chart is really a composite of individual daily charts. Consider the following chart which shows the PAH concentrations for one day starting at 1 am and going thru until midnight.:
© 2007-2017 Clean Air Revival Home page at
http://BurningIssues.org
© 2007 Clean Air Revival Home page at
http://BurningIssues.org
Go to top