
For a period of more than 10 years from 1995 to the present, Dr. Wayne Ott of the Statistics Department, Stanford University measured indoor and outdoor particulate levels in his residential neighborhood in Redwood City, CA. This material is soon to be published and Burning Issues is fortunate to be able to present several graphs from the upcoming paper. The selection of graphs is Burning Issues's as is the commentary presented. We do not presume to speak for Dr. Ott.The commentary was written by Donald Rozenberg. When the paper is published, the appropriate references will be sited here. We will limit ourselves to only the most obvious conclusions and they are ours. See understanding the Charts.
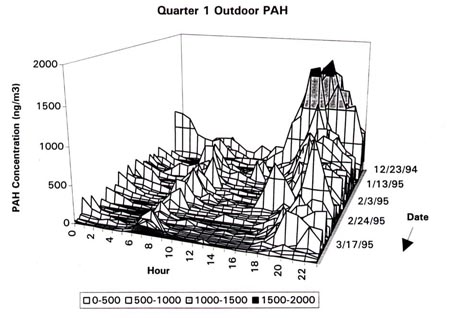
Figure 1
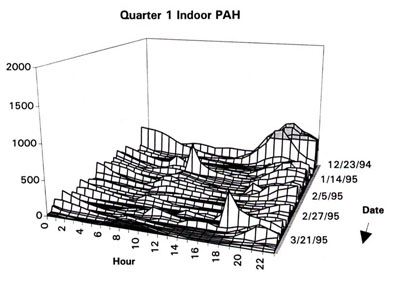
Figure 2
Several interesting things can be seen from these charts:
Looking at Figure 1, one notices that the PAH concentration is highest on Christmas Day. In fact, it is a fact that Christmas has the highest PAH concentrations of the year by a substantial amount. The only other day which even comes close is Thanksgiving.
Looking at Figure 2, one sees that even inside a house with windows and doors closed, substantial levels of PAH's are present. It has been stated that indoor levels can achieve as much as 70 percent of the outdoor levels. In this case, the indoor levels are less than that fraction of outdoor levels, probably reflecting the fact that this is relatively new construction. What this means is that there is no escape from a neighbor's smoke. Remember that the PAH's and most dangerous particulates ( the smallest ones) can't be seen and are odorless.