
Science: Understanding the 3-D Charts
This page will explain how to interpret a 3-D chart like the following:
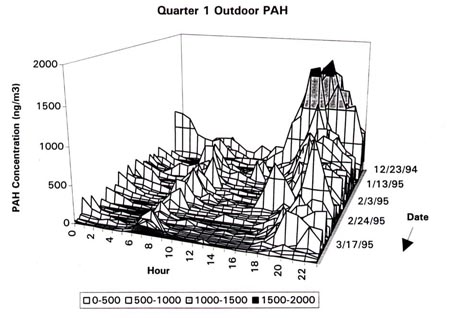
This chart is really a composite of individual daily charts. Consider the following chart which shows the PAH concentrations for one day starting at 1 am and going thru until midnight.:
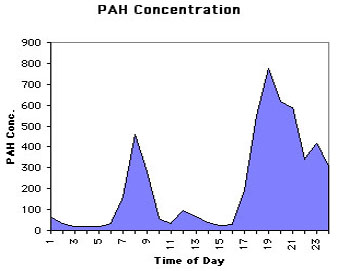
Now think of having a line chart like the above for each day in the quarter and each is printed on a transparent plastic card. Now think of these cards in a stack with the card for the first date at the back and the card for the next date in front of it and so forth. Except for the start time and end time you would have essentially the the 3-D chart at the top of the page.
© 2007 Clean Air Revival Home page at http://BurningIssues.org