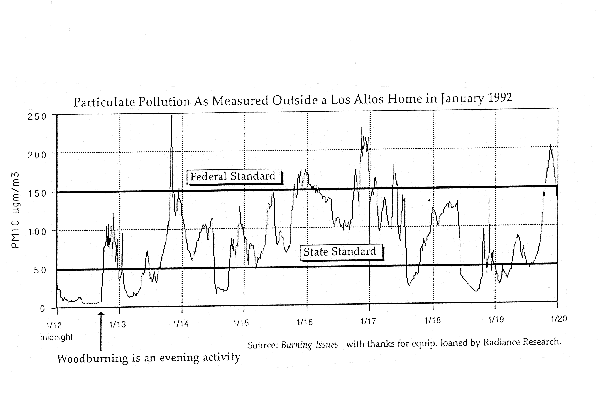
The evening smoke pollution pushes the pollution higher, day by day.
Conference PresentationData from the Neighborhood Monitoring above was presented in a poster session at the Conference on Mortality and Morbidity at UC Irvine in January 1994. See Abstract: "Real-Time Monitoring of Airborne Particles" , Mary J. Rozenberg, Inhalation Toxicology, Taylor & Francais, Bristol, PA, Vol. 7, No.5, July 1995., pg 833
From Thanksgiving 1992, through January 1993, air borne particulates smaller than 2.5 microns in diameter were measured at a fixed site in a residential neighborhood of the San Francisco Bay Area. The recording interval was 15 minutes using a Nephelometer manufactured by Radiance Research of Seattle, Washington. The data clearly shows that particulate concentrations increase most rapidly in the early evening and that the highest concentrations occur in the late evening, after 11 PM. This clearly suggests that the particulates are generated by non industrial and non automotive sources. The data when processed to generate average weekdays and average weekend days, show curves that are surprising similar. Again, this suggests that the particulates result from domestic processes, the most likely of which is Residential Wood Burning. This is consistent with the results other studies performed in the San Francisco Bay Area. This session will present the collected data.
Since indoor particulates levels approach 70 % of the outdoor levels, it is clear that Residential Wood Burning causes dangerous levels of indoor air pollution in residential neighborhoods at times when people are in their homes subject to the health effects of particulate pollution.

The graph shows the time of day along the bottom and the day of the week. On the left vertical, we see the mass of the particulates measured and the California State Standard and the old Federal Standard are shown at 50 and 150 micrograms per square meter, by solid lines that extend over the entire week. Again we see the rapid rise in fine particulate at the end of the day. The vertical dotted lines are midnight. Do you see how the pollution falls after bedtime? But it does not fall back to clean. This week shows a typical weather pattern. There was no rain to wash out the air. The evening pollution pushes the pollution higher, day by day. These are the days when visibility is significantly degraded and emergency rooms begin to fill with people.
[The poor quality of this chart is due to scanning technology. We include it here as it is possible to see the pattern of the daily increases in PM2.5 due to the additional burden of evening wood burning.]
