
General Level ol Environmental Impact
Although this massive shift to wood is a welcomed transition from the viewpoint of reducing our dependence on foreign oil and is being encouraged by both federal and state governments,(10-11) it is being done without an adequate understanding of the relative cost-benefits of this form of energy or its environmental impact. Results from recent studies have shown RWC systems in their current state of development to have potentially significant environmental impacts, even when used by a small portion of the residences in a large metropolitan airshed.
The first and only direct measurement of the impact of RWC sources on ambient air particulates was recently made by Cooper, et al. 2 This study showed that on a moderately cold (minimum temperature of 29°F) day in January, 1978, 51% of the respirable (<2.5 pm) air particulates (35 tag/ma) in a Portland, OR residential area were from RWC sources. These results were based on the measurement of the carbon-14 content of the respirable air particulates, a nearly unique tracer for RWC emissions in January and one which is not present in fossil fuels. These results were also supported by organic and inorganic chemical measurements and chemical mass balance calculations(1)
Two recent surveys taken in the Portland area tend to support this and possibly even higher levels of impact(12-13) Hatchard and Day(13) for example, have estimated, on the basis of an extensive survey, that about 4600 tons of mostly respirable particulates were emitted in 1978 in the PortlandVancouver Air Quality Maintenance Area (AQMA) from RWC sources. January emissions from this source would have been about 920 tons, while emissions from all other sources contributed only 850 tons of respirable particulates}
Similar surveys in two smaller northwest communities have suggested high relative emission levels.(14-15) Medford, OR and Missoula, MT are both located in small valleys which experience frequent winter inversions trapping air pollutants. Hatch estimated that 215 tons of air particulates were emitted into the Medford airshed on an annual basis in 1977. Cooper(16) has estimated that RWC sources contribute between 20 and 30% of the air particulates in Medford annually. Even higher percentage contributions would be expected in the winter when the monthly average total suspended particulate levels exceed 200 eg/ma. The results of a survey by Otisa suggest that , almost 300 tons of air particulates were emitted annually in the Missoula valley in 1977 and he estimated that by 1980 this source would account for 40% of the winter TSP emissions and a much larger portion of the respirable particulates.
Surveys and modeling studies in Bangor, Maine, Chattanooga, Tennessee, Vail, Colorado, and the State of New Hampshire also suggest significant emissions a`nd high air .. quality impacts.(17-20) Butcher and Sorenson(18) have estimated the impact in Bangor, ME based on their emission factors and simple dispersion modeling to have been about 8 pg/ma in 1976 when it was assumed that 4% of the space heating energy requirements were derived from RWC. The worst case contribution in Bangor where 100% of the heating load was assumed to be supplied by wood was estimated to be about 100 pg/m3. One of the conclusions of the Chattanooga study(17) was that in all likelihood,"... valley industries would be required to offset wood-burning stove contributions to the ambient baseline through additional control." The results of the Vail study showed that emissions from RWC could contribute up toD.64 tons of particulates per day to the valley's air pollution levels.(13)
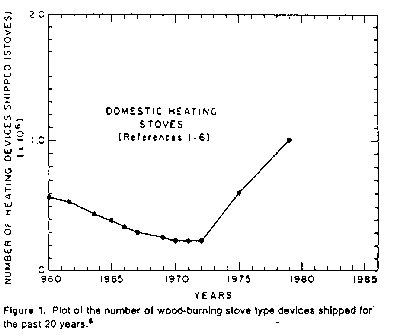
Thus, the measured results by Cooper, surveys, and modeling studies conducted in the northeast, southeast, west, and northwest, all suggest a significant air quality impact due to RWC sources, even as early as 1976. The growth in sales of RWC appliances over the past few years increases the concern over the latent air pollution potential from this growing source.
| Pollutant | Reference | Stoves | Fireplaces |
|---|---|---|---|
| Acenaphthylene | a,b | 0.064 | 0.010 |
| Flucrene | a,b | 0.020 | 0.0047 |
Anthracene/phenanthrene |
a,b | 0.096 | 0.0088 |
| Phenol | a | 0.1 | 0.02 |
| Fluoranthene | a,b | 0.022 | 0.0016 |
| Pyrene | a,b | 0.019 | 0.0016 |
| Benz(a)anthracene a,b | a,b | 0.0177 | 0.0019 |
| Chrysene | a,b | ||
| Benzofluoranthenes | a,b | 0.0135 | 0.0019 |
| Benzo(a)pyrene | a,b | 0.0025 | 0.00073 |
| lndeno | a,b | ||
| Benzo(ghi)perylene | a,b | 0.0059 | 0.0014 |
| Dibenzanthracenes | a,b | 0.001 | 0.00018 |
| Acenaphthene | a | 0.0064 | 0.0012 |
| Ethyl benzene | a | 0.041 | 0.0091 d |
| Phenanthrene | a,b | e | |
| Dibenz[a,h]anthracene | b | ||
| TOTAL | 0.41 | 0.063 |
a DeAngelis, et al.(21) (grams emissions per kilogram wood).
b Lee, et al.(22)
c Reference 31: for fireplace-.009 g/Kg or about 0.01%.
Reference 32: for pine needles--.003 to .03% particulates.
Reference 53: for leaves, grass, branches-.004%.
Reference 21: Benzopyrenes/perylene: fireplace-.0015 g/kg or about
.016% stove-.009 3/kg or about .1%. Assume l/3 of above is B(a)P and
averaging fireplace values yields 0.008% for fireplace and 0.03% for stove.
d May include xylenes.
e Included in anthracene category
Go to Page 1 | 2 | 3 | 4 | 5 | 6 | 7